Java Garbage Collector: An Introduction to the Different Algorithms
Introduction
In this article, we describe a problematic situation we encountered during the development of a project at AIknow, which led us to delve deeper into how the Garbage Collector works, as well as the differences between the various existing Garbage Collecting algorithms. Finally, we will explain how we managed to resolve the issue.
Use Case
For one of our clients operating in the telecommunications sector, we developed a web application that implements a dispatcher functionality for all communications exchanged within a radio network. The backend, developed in Java, must be able to process a large volume of messages when the radio network consists of hundreds or even thousands of radios (some installations handle over 300 messages per minute). As a result, the application consumes large amounts of memory, making it necessary to use a Garbage Collector that can quickly free up unused space in the Heap Space.
The Problem
In situations of application stress, we encountered two serious issues:
OutOfMemoryException: this exception is thrown when the application tries to use more memory than what has been allocated- Application freeze: the Java application would become unresponsive for about 15 seconds, without producing any logs or output.
This second issue was particularly critical, as all messages received during those 15 seconds of inactivity were completely lost.
Our Investigation
To resolve the OOM (OutOfMemoryException), we analyzed the application’s memory usage.
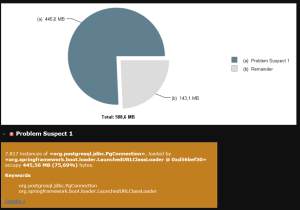
We created a test environment with a dataset similar to the production one, generating JVM heap dumps at regular intervals and analyzing them with Eclipse MAT. Thanks to MAT’s automatic anomaly detector, we obtained graphs like the one shown in the figure and identified a memory leak that was causing improper memory usage.
As for the freeze issue, it was necessary to monitor memory usage in real-time, hoping to detect abnormal behavior during the application stalls.
Before presenting the results of our investigation, it’s useful to introduce some definitions regarding the structure of the Heap and how the Garbage Collector works, since we will use more specific terminology in the final part of the article.
How the Java Heap Space is Structured
The Heap Space is the portion of physical memory used by Java to dynamically allocate objects and classes during application runtime. The Garbage Collector periodically intervenes to free up memory.
In theory, the Garbage Collector analyzes all the objects in the Heap Space that are still reachable from active references; all others are considered garbage and are removed (an operation known as collection).
In practice, however, a different approach is used. Empirical observation shows that most Java objects are short-lived, while only a few persist for longer periods. This insight led to the division of the Heap into Generations, where objects are placed according to their age:
- Young Generation
This is where new objects are allocated. When this area fills up, a minor collection is triggered. The Young Generation is further divided into the Eden Space and Survivor Space. An object that survives a certain number of minor collections is promoted from Eden to Survivor, and then eventually to the Old Generation. - Old Generation
This contains long-lived objects and is also known as the Tenured Space. When this area becomes full, a major collection is triggered, which cleans the entire Heap. Major collections are less frequent but significantly more expensive in terms of computational resources.
The goal of the Generations structure is to minimize the need for performing major collections.
Real-Time Heap Memory Monitoring
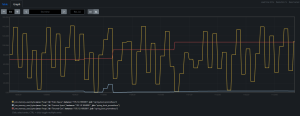
To monitor heap memory usage in real time, we used Prometheus—an intuitive tool that allows for the visualization of many JVM metrics through custom graphs.
- yellow = Young/Eden
- light blue = Young/Survivor
- red = Old/Tenured
How to Read Garbage Collector Logs
To confirm our hypothesis, we enabled Garbage Collector logs by adding the `-verbose:gc` parameter to the JVM startup command.
[768327.260s][info][gc] GC(24076) Pause Full (Allocation Failure) 956M->215M(989M) 15921.040ms
[768327.280s]: timestamp since application startup[info]: log level[gc]: indicates a Garbage Collector logGC(24076): Garbage Collector identifierPause Young/Full: type of collection (minor or major)(Allocation Failure): reason for the collection (normal — indicates that the JVM was unable to allocate memory and therefore triggered a collection)956M->215M(989M): memory used before and after the collection, and total heap size15921.040ms: duration of the collection (approximately 15 seconds)
Different Garbage Collecting Algorithms
We identified that the algorithm being used was the Serial one. At startup, the following message appeared:
[0.034s][info][gc] Using Serial
- The server is multiprocessor, so a multi-threaded GC is required
- The dataset is well over 100 MB
There are other multi-threaded algorithms, such as G1, that are much more efficient. In our case, by switching to the G1 GC, even major collections (logged as Concurrent Cycle) were executed in the background and completed in significantly less time (373 ms compared to roughly 15 seconds with the Serial GC):
[1913.644s][info][gc] GC(209) Pause Young (Normal) (G1 Evacuation Pause) 220M->131M(256M) 84.159ms

[1915.310s][info][gc] GC(211) Concurrent Cycle

[1915.683s][info][gc] GC(211) Concurrent Cycle 372.997ms
Which algorithm should I choose for my application?
In summary:
- Small datasets (up to 100 MB):
-XX:+UseSerialGC - Single processor execution without pause constraints:
-XX:+UseSerialGC - Maximum performance without pause constraints or with acceptable pauses (≥1s):
-XX:+UseParallelGCor default - Pauses shorter than ~1 second and response time as a priority:
-XX:+UseG1GCor-XX:+UseConcMarkSweepGC - Very large heaps and response time as a high priority:
-XX:+UseZGC
Conclusion
In this article, we explained what the Garbage Collector is, how Java Heap memory is structured, and how to enable and interpret GC logs. We then analyzed a real-world case that highlighted the importance of properly configuring the JVM by selecting the most appropriate Garbage Collection algorithm based on the characteristics of the Java application. Finally, we outlined the key differences between the various Garbage Collecting algorithms.
Do you need support to improve the performance of your Java application? Contact us
